
Introduction
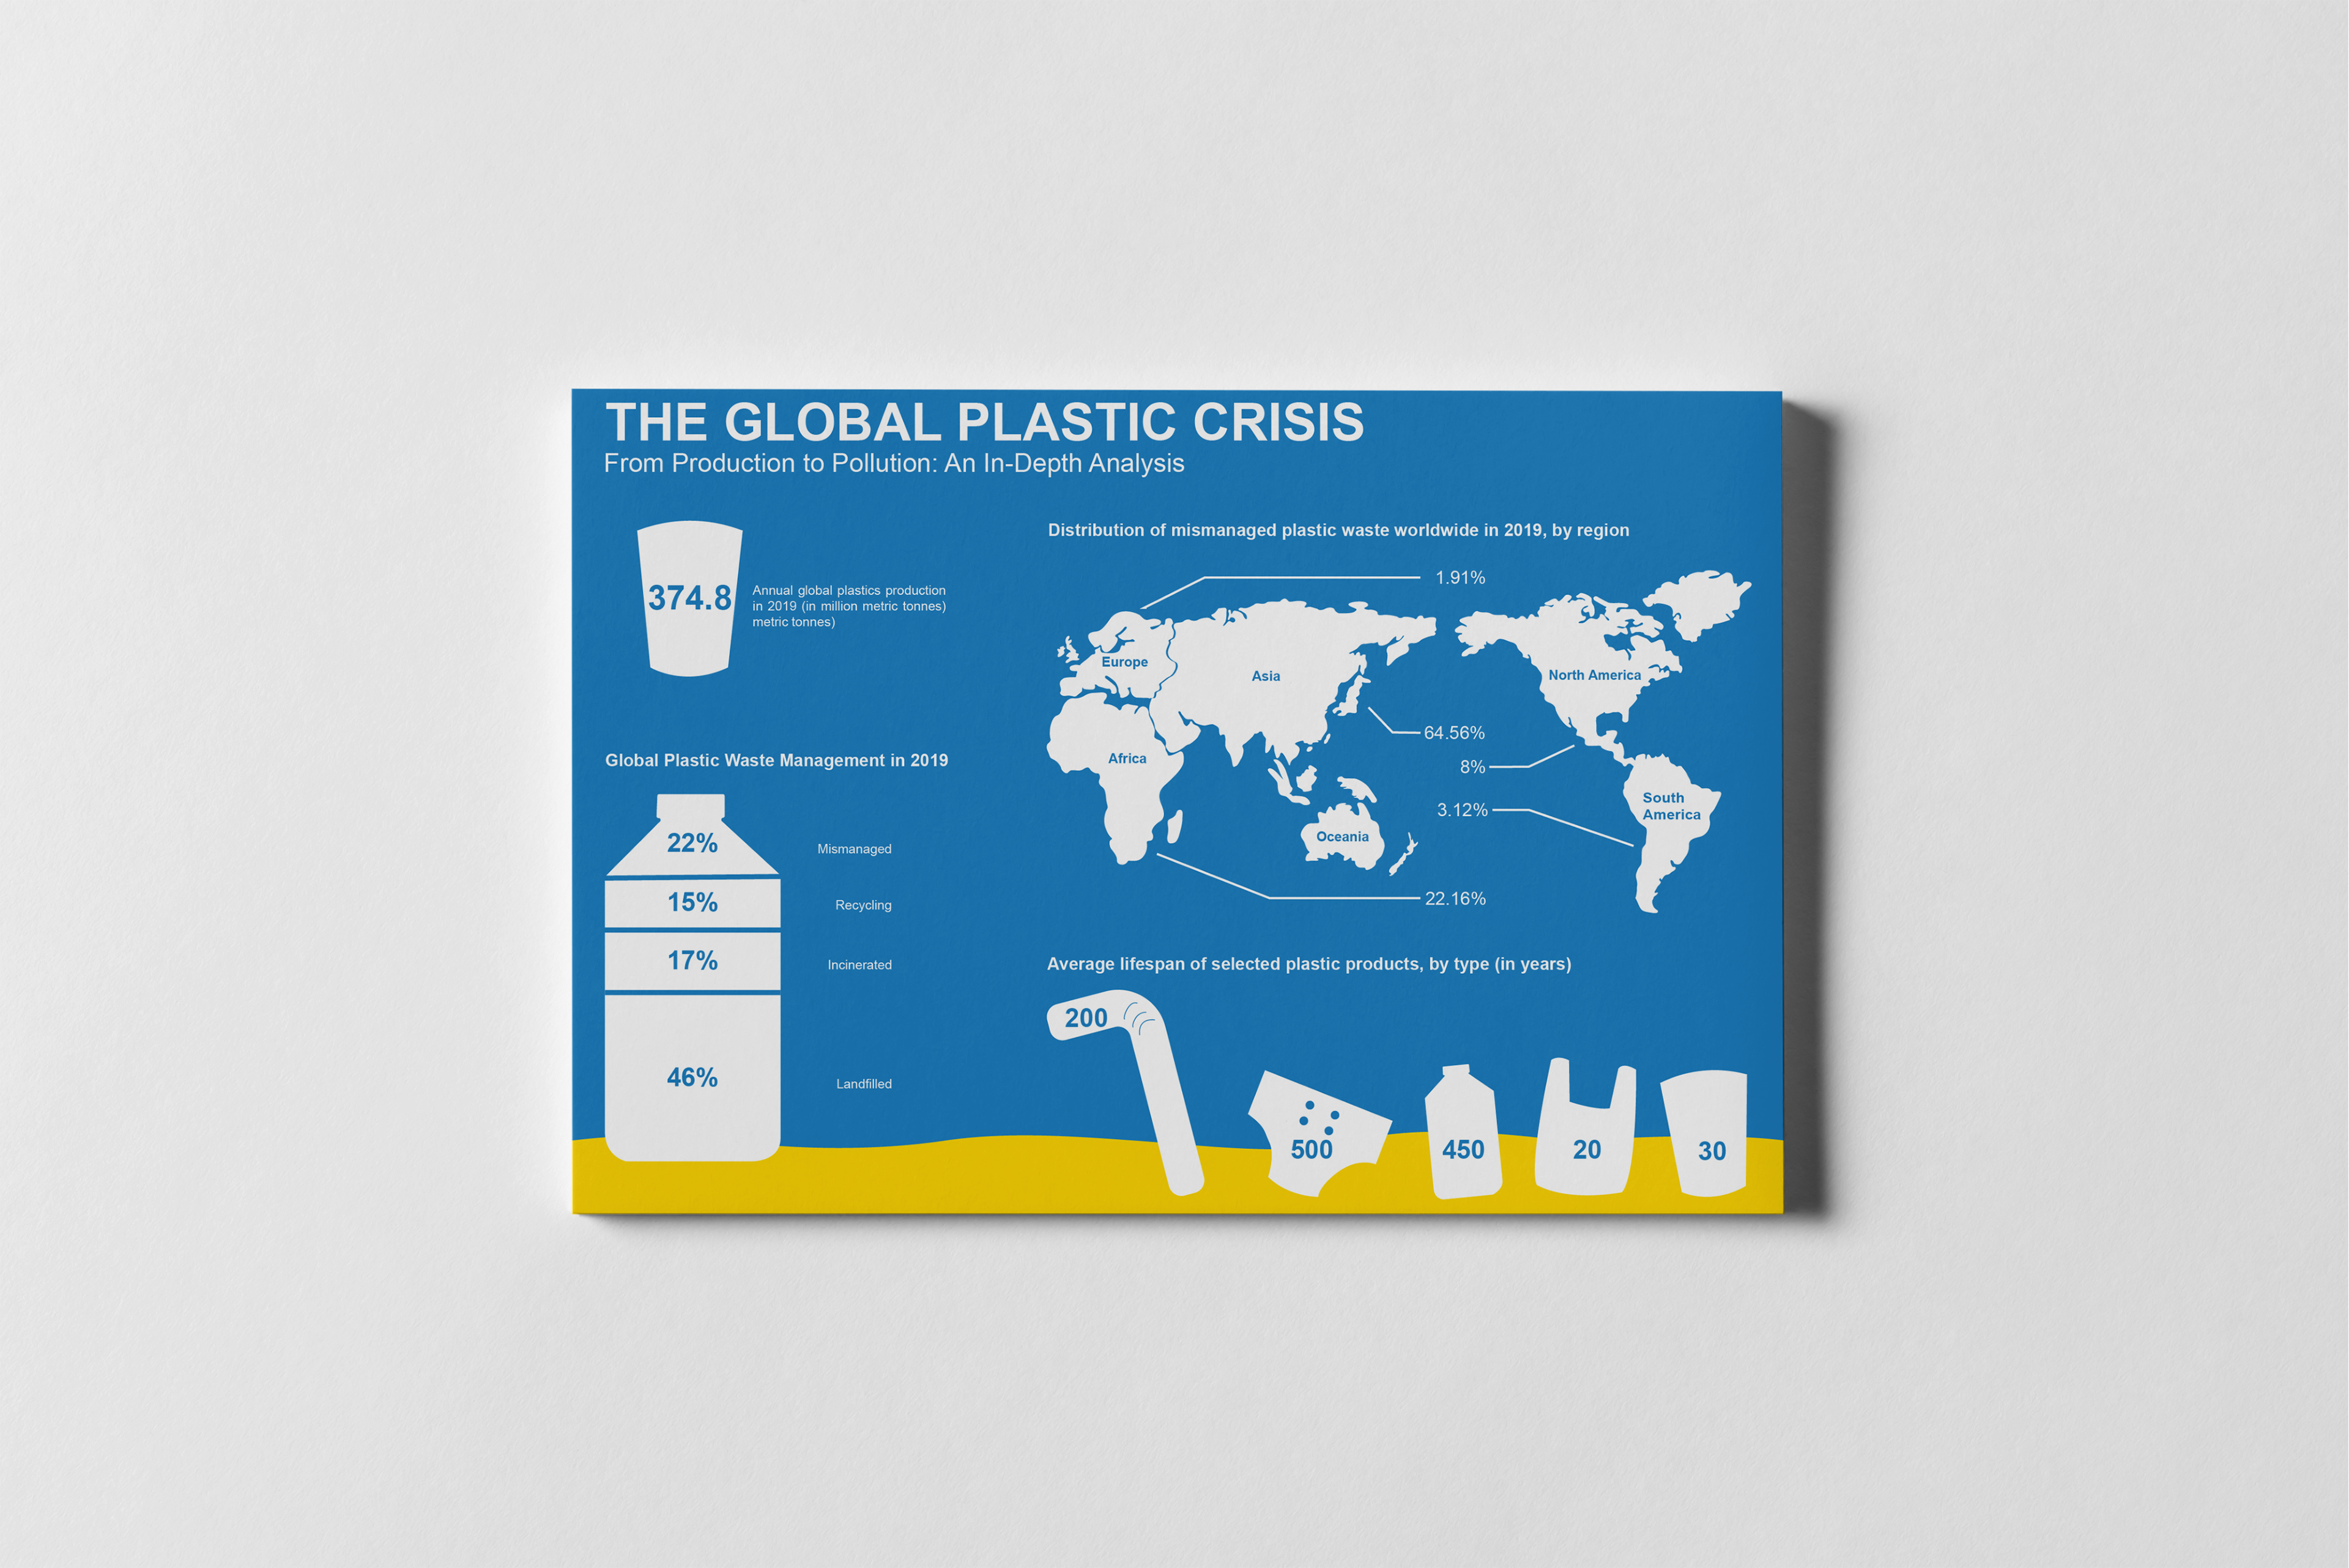
I produced an infographic about plastic trash to increase awareness of the dangers of plastic items. The audience is to be given unbiased information to inspire action. The infographic highlights the terrible impacts of plastics while providing facts on their manufacture, disposal, and degradation times. This report provides the finished project, including the elements that influenced my choice, the actions I took, the challenges I ran into, the solutions I came up with, and the lessons I learned moving forward.
Approach to Completing the Task
To complete this infographic, I approached it from three perspectives: how to tell a story, simple presentation, and visual elements. I created a vector graphic to describe the plastic waste crisis through the main headline, subheadings, and data. I combined precise numerical data with a simple presentation, using a vector image of an ocean blue as the background, white fonts, and a beige sandy beach as the visual elements. This resonated with the audience while ensuring the infographic was easy to read. I put all the data I had accumulated into an Excel spreadsheet and started narrowing down the type of data I wanted to use. I then sketched several versions on paper to work out the layout I wanted. I used Illustrator to create the icons and diagrams and finally put them into InDesign to create the finished product.